
Institute Colloquium: How to read large graphs?
Date
Monday, December 1, 2014 16:30 - 17:30
Speaker
Nathan Linial (Hebrew University of Jerusalem)
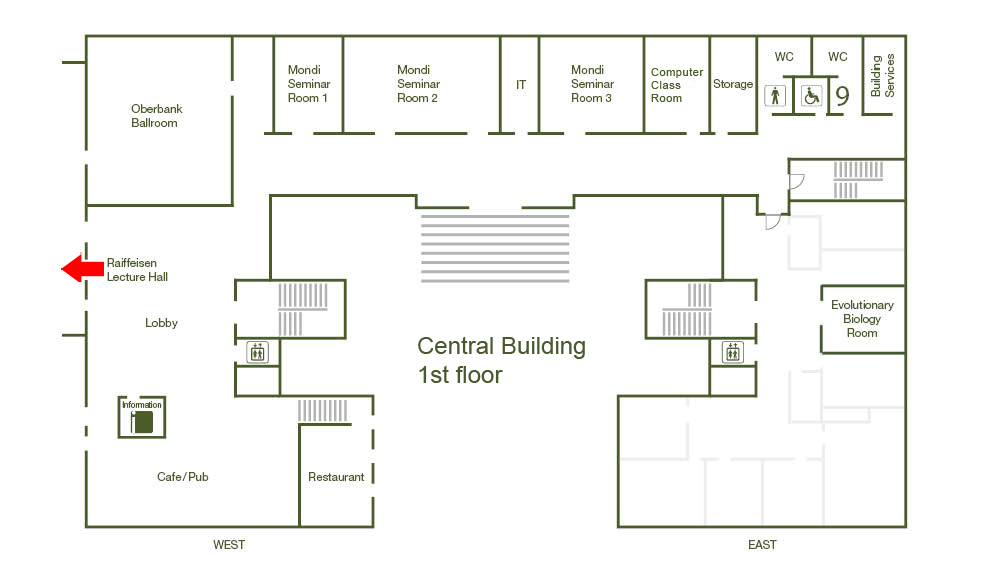
Location
Raiffeisen Lecture Hall, Central Building
Series
Colloquium
Tags
Institute Colloquium
Contact
Url
What do you do with a vast number of real numbers that come from some scientific, economic or other domain? You need not be a statistician to know how to draw the corresponding histogram, compute averages, standard deviation etc. and arrive at some conclusions regarding the source of these numbers. Statisticians can do much more, of course, but these basic techniques have become common knowledge. In recent years many types of data that we are observing come in the form of a large graph (aka networks). Our main question is: How can you similarly draw conclusions by observing such a graph? In other words, average, variance modes etc. give you a handle on statistical data. Are there, likewise, features of a given large graph which convey key information about the system that it represents? At present we do not know how to address these questions and it is a major scientific challenge to develop good answers. I will explain the notion of local views of a big graph and why they offer at least a first step in this direction.